| |
The ontogenetic alteration of photopic and scotopic sensitivity thresholds were measured using optomotor response in Haplochroms sauvagei, H. argens and H. pyrrhocephalus. The fishes were exposed to a horizontally moving pattern of vertical lines, which enforced them to swim along as long as the lines were visible (after Van der Meer, 1991; Van der Meer, 1994).
The major aim of this investigation was to test the predicted morphological data on sensitivity (photopic and scotopic thresholds) during growth in these species.
The fish
Specimens of the molluscivore Haplochromis sauvagei and of the zooplanktivores H. argens and H. pyrrhocephalus were caught in the Mwanza Gulf of Lake Victoria and raised in the laboratory. The ontogenetic stages used in the optomotor experiments were offspring after several generations in capture.
The apparatus
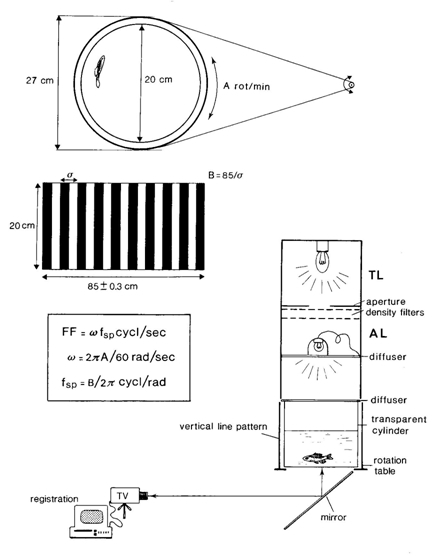
The optomotor response was evoked in a transparent cylindrical tank surrounded by a photographically produced vertical pattern of black and white lines of equal width that could rotate at various velocities. The spatial frequency (fsp) was varied by changing the number of cycles (1 black + 1 white line) of the pattern (B) according to
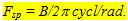 (1) (1)
The angular velocity (w = 2pA/60 rad.sec-1) could be varied from a rotation speed (A) of 3 rot/min to 60 rot/min. The angular velocity and spatial frequency together determine the flicker frequency (FF) according to
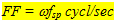 (2) (2)
Hence (1) en (2) follows, that
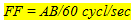 (3) (3)
Consequently, A and B were reciprocally related: the flicker frequency was kept constant by increasing the spatialfrequency and simultaneously decreasing the angular velocity, or vice versa.
The line pattern and tank were illuminated from above by two different light sources. The lower source (40W) provided an illumination of 40 lx at the bottom of the tank and was used to keep the fish light adapted (adaptation-light-intensity: ALI). The upper source (8V projection lamp) was adjusted by aperture to provide an illumination of 0,5 lx at the bottom of the tank. This illuminance could be lowered further by the addition of 0,3 log unit Lee neutral density filters (test-light-intensity: TLI). The light measurements were carried out with an H&B lux-meter type EBLX3. The resulting intensity of the TLS was calibrated previously (Van der Meer, 1991). The absorption characteristics of the filters allowed registration of the fish’s behaviour by means of an infra-red sensitive video camera.
When measuring the scotopic thresholds, the ALI was replaced by a green light emitting diode (LED), whereas the TLI was reduced to a level way below threshold (not evoking any optomotor response) by utilizing a sufficiently high number of density filters and it was merely used for the purpose of recording. The illuminance was altered by variation of the electric current feeding the LED after it had been calibrated in advance with the lux-meter.
The optokinetic movements
Expression of the optomotor response could be either swimming along with the moving line pattern close to he cylindrical wall, or turning around like a compass needle at the centre of the tank. Other responses, like eye-movements, were not recorded.
The procedure
Before measuring the photopic and scotopic thresholds it is necessary to establish the flicker fusion frequency (FFF) in order to use a suitable spatial frequency at a specific rotation speed.
The flicker frequency that the individual fish was just unable to distinguish was defined as the flicker fusion frequency (FFF). The specimen was remained light adapted using ALI. The selected TLI and spatial frequency were not changed during he experiment. The rotation of the line pattern was started at low speed and simultaneously the adaptation light was switched off for 30 s at the most, exposing the fish to the TLI, whereupon the adaptation light was switched on again for at least 3 min and the rotation was stopped. If the optomotor response had continued during the whole period of exposure to TLI, the rotation was set at a higher speed. And the procedure was repeated (each exposure was started with the fish in a stationary position). The lowest rotation speed (A) at which no response was observed, was used to calculate the FFF for the used pattern (fsp) at that light level.
The illuminance whereby the light adapted fish was just unable to distinguish the moving line pattern was called the photopic threshold. After a specimens was placed in the tank, it remained light-adapted. The rotation of the line pattern was stared at a specific speed throughout the duration of the experiment. As a result the fish was constantly stimulated to move along with the line pattern. The adaptation light was switched off for 30 s at the most, exposing the fish to the much lower light level of the TLI, whereupon the adaptation light was switched on again for at least 3 min. If the optomotor response had not stopped during the 30 s of exposure to the TLI, one density filter was added and the procedure was repeated. Note, that in contrast to measuring the FFF, each exposure began with the fish already swimming along with the rotating line pattern. In the series of decreasing light levels, the highest level at which no response was observed, was registered as the photopic threshold value. During this entire procedure the fish remained light adapted: retinomotor movements did not occur (Van der Meer, 1991).
The illuminance whereby the dark adapted fish was just able to distinguish the moving line pattern was called the scotopic threshold. After a specimen was placed in the tank, it remained in complete darkness for 1 h to become dark-adapted. The selected spatial frequency was 7,3 c/rad and the rotation was set at minimum speed. Once the rotation of the pattern was started, it was continued during he experiment. The irradiance of the LED was gradually amplified by a factor two at intervals of 5 min. The lowest ight level evoking a response was registered as the scotopic threshold value.
Results & Discussion
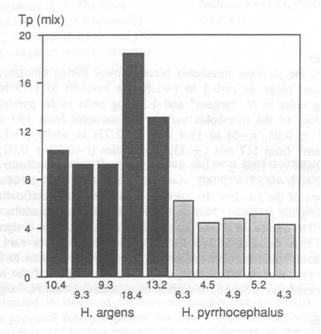
The results of the measured FFF in H.sauvagei were presented by Van der Meer (1994) showing limitations of the angular velocity in adults and of the spatial frequency in juveniles. This outcome was used to choose a moderate angular velocity and a low spatial frequency to measure the threshold values.
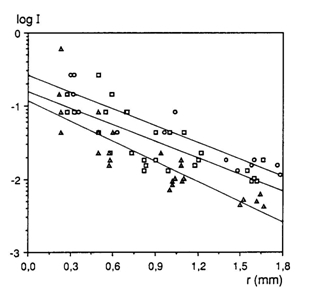
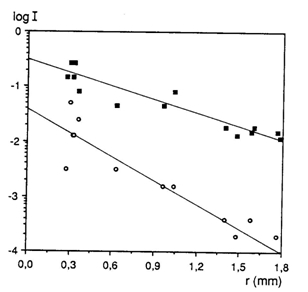
In all three species the photopic thresholds lowered during ontogeny. During growth of the eyes with a factor 6 (from lens-radius r = 0,3 to r = 1,8) the photopic thresholds dropped 1, 15 log units in H. sauvagei, 1,18 log units in H. argens and 1,38log units in H. pyrrhocephalus. The absolute threshold values of the juveniles did not significantly differ due to noise and had a mean value of 148 mlx. Neither adult H. sauvagei and H. argens showed significantly different photopic thresholds measuring 15 (+ 2,7) mlx and 12 (+ 3,9) mlx respectively. Only adult H. pyrrhocephalus had a significantly lower photopic threshold of 5 (+ 0,8) mlx.
The degree of photopic threshold reduction in H. sauvagei (1,15) was practically equal to the prediction based on the increasing cone size (Vc) during growth (1,17). The measured difference in photopic threshold between adult H. argens and H. pyrrhocephalus is only slightly larger than the predicted difference: The ratio between their photopic thresholds (Ia/Ip) had a mean value of 2,3 compared to the ratio between the size of their double cones (Vdp/Vda) with a mean value of 2,1.
The scotopic threshold was only measured in H. sauvagei and decreased 2.13 log units during ontogeny. This value considerably exceeded the prediction derived from the increasing rod convergence (1,6 log units). The assumptions that all ganglion cells are involved in scotopic vision and that the photon catching ability of a rod does not change during growth, may be incorrect.
|
|
|